The problem
At SAP Labs in 2024, I inherited a FastAPI service whose one job was to aggregate telemetry from three clouds, GCP, Azure, and an internal OpenStack fabric, into a single normalized view that every internal cost dashboard read from. Every dashboard refresh triggered a fan-out to roughly 40+ endpoints per cloud: billing snapshots, resource inventory, quota state, per-project usage, per-region utilization, and a long tail of smaller reads.
End-to-end, a cold refresh took 76 minutes.
Seventy-six minutes is a fine number for a nightly batch job. It is a terrible number for a dashboard the FinOps team wants to poke at during a Tuesday-morning cost review. The team's live experience of the pipeline was: click refresh, go make coffee, come back, coffee is cold, dashboard is still spinning. When more than one team hit :00 of the hour at once, which, of course, they did, because scheduled dashboards default to the top of the hour, the whole thing got worse, not linearly.
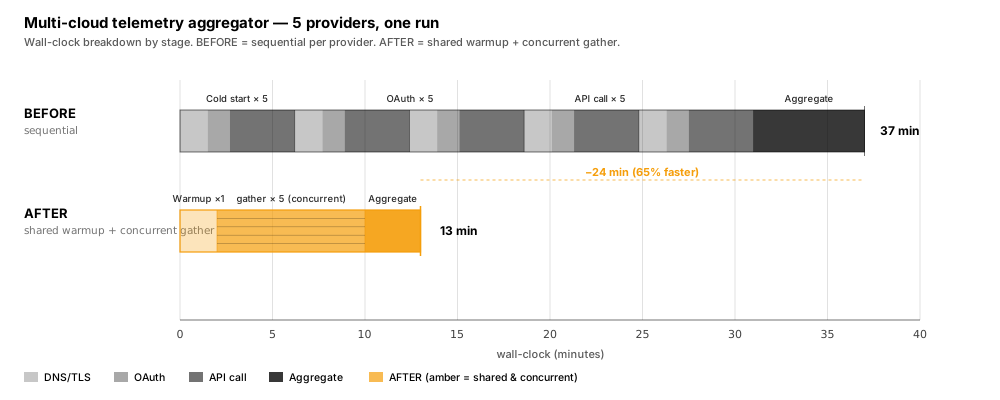
The goal I signed up for was to make this feel interactive. "Interactive" was never going to mean sub-second on a cold fetch, three cloud APIs and a hundred-plus endpoints don't let you. But it needed to be somewhere a human would tolerate. I landed at 13 minutes on the cold path, and the shape of the fix is the whole post.
What was actually slow
The naive shape of the service was the shape anyone would have written first. A FastAPI endpoint per cloud. Each endpoint iterated over its endpoint list, called each one with a fresh requests.Session(), waited for the response, and moved on. Every call did its own TCP handshake, its own TLS handshake, and, on the first call of the worker's life, its own OAuth token exchange.
I put a time.perf_counter() around a representative single call, one small GCP monitoring read, and got a breakdown that looked roughly like this:
| Phase | Cold call | Warm call |
|---|---|---|
| DNS resolution | ~35 ms | 0 ms (cached) |
| TCP connect | ~40 ms | 0 ms (reused) |
| TLS handshake | ~180 ms | 0 ms (reused) |
| OAuth token exchange | ~320 ms | 0 ms (still valid) |
| Actual API request | ~140 ms | ~140 ms |
| Total | ~715 ms | ~140 ms |
The API itself was doing ~140 ms of useful work. Everything else was fixed cost per request, being paid over and over. Multiply by ~40 endpoints per cloud, three clouds, sequential, and the 76 minutes wasn't a mystery. It was arithmetic.
Two things made it worse than the arithmetic suggested. First, the workers were sized for burst: each dashboard refresh spawned its own worker task, and every one of those workers cold-started with no cached token and no warm connection pool. Second, at :00 of the hour, when scheduled refreshes stacked, the workers all fought for the same OAuth endpoints at the same instant, and Azure's token endpoint in particular has a rate limit that will 429 you cheerfully if you knock on it a dozen times in the same second.
The naive pipeline wasn't slow because the clouds were slow. It was slow because it was paying the price of "first call ever" on every call.
The three fixes
(a) Async scheduling with asyncio.gather
The single biggest change was to stop iterating over endpoints and start fanning them out. Sequential requests were the wrong default for a workload where every call was network-bound and mostly waiting.
I rewrote the fetcher on top of httpx.AsyncClient and let asyncio.gather schedule the per-endpoint calls concurrently within a cloud, with a semaphore capping concurrency so we didn't just move the bottleneck to the cloud's server-side rate limit.
Per-cloud wall clock dropped by close to an order of magnitude on the fan-out itself, before any of the other fixes landed. Three clouds running in parallel at the top level (also via gather) meant the end-to-end shrank in the same shape.
(b) One connection pool, shared across everything
The requests.Session() per-call pattern was the second big cost. Every call was reopening a TCP+TLS conversation that had been torn down 40 ms ago.
I replaced the pattern with a single httpx.AsyncClient held at application scope, created in FastAPI's lifespan context, torn down on shutdown, with a keep-alive pool sized to the concurrency ceiling. Every request went through that one client. The pool amortized TCP+TLS across the run.
# The shared client and fetcher. httpx.AsyncClient is threadsafe-across-tasks
# and holds the keepalive pool. One instance per cloud, held for the lifetime
# of the FastAPI process, not per request, not per worker task.

import asyncio, httpx

class TelemetryFetcher:
    def __init__(self, base_url: str, token_provider, concurrency: int = 32):
        limits = httpx.Limits(
            max_keepalive_connections=concurrency,
            max_connections=concurrency,
            keepalive_expiry=60.0,
        )
        self.client = httpx.AsyncClient(base_url=base_url, limits=limits, timeout=30.0)
        self.token_provider = token_provider
        self.sem = asyncio.Semaphore(concurrency)

    async def _fetch_one(self, path: str) -> dict:
        async with self.sem:
            headers = {"Authorization": f"Bearer {await self.token_provider.get()}"}
            r = await self.client.get(path, headers=headers)
            r.raise_for_status()
            return r.json()

    async def fetch_all(self, paths: list[str]) -> list[dict]:
        return await asyncio.gather(*(self._fetch_one(p) for p in paths))
The measurable effect: warm-call fixed cost dropped from ~220 ms (DNS + TCP + TLS) to effectively zero for every request after the first per host. On a run touching 120+ endpoints, that's ~26 seconds of pure setup cost that stopped being paid.
(c) OAuth token warmup and background refresh
The third cost, the one I found last because it hid behind the first two, was OAuth. Each cloud's token exchange was ~200-320 ms, tokens were per-worker, and workers were cold-starting on every burst.
I moved token acquisition out of the request path entirely. On FastAPI startup, the lifespan hook pre-fetched a token for each cloud. A small background task per cloud watched the token's expires_in and refreshed the token five minutes before expiry. Requests read the current token from an asyncio.Lock-guarded holder, never blocked on it under normal operation, because the token was always already valid.
The visible effect was that the first request of a burst stopped costing 300+ ms more than every subsequent request. On a cold :00-of-the-hour burst, this alone was worth roughly a minute across the three clouds.
What broke first
The first version of the concurrent fetcher deadlocked itself under burst load, and I did not see it coming.
Here's what happened. Dashboards refreshed at :00. Each dashboard, in production, hit the aggregator endpoint concurrently. Each of those requests fanned out to 40+ endpoints on each of three clouds. The connection pool was sized to 32 keepalive connections per cloud, which was fine for one dashboard. Under five simultaneous dashboards, the pool saturated, new requests queued waiting for a connection, and the queue backed up past the client-side timeout. Everything downstream got httpx.ReadTimeout and the aggregator returned a partial result.
Two changes fixed it, both boring:
- A token-bucket rate limiter in front of each cloud's fetcher. The bucket was sized to the cloud's actual rate limit, not to some optimistic guess. Requests over the limit waited on the bucket instead of piling into the connection pool.
- A small stagger jitter, a random 0-500ms sleep, at the start of each dashboard's fan-out. This flattened the
:00thundering herd across the first half-second of the minute. Nobody was going to notice a 500ms delay on a 13-minute job; the connection pool noticed a lot.
I'd seen this pattern before in a fleet-ops context, a synchronized burst overwhelming a shared resource that was correctly sized for the average, wrongly sized for the peak, but I still walked into it here. The fix, both times, is that if a resource is shared and the workload is bursty, either the resource has to be sized for the peak or the workload has to be de-synchronized.
The numbers
Directional, from our workload, three clouds, ~40 endpoints per cloud, cold cache, five dashboards firing at :00.
| Stage | Wall clock | Speedup vs baseline |
|---|---|---|
| Baseline: sequential, per-call session, cold OAuth | ~76 min | 1.0x |
+ async fan-out (asyncio.gather + httpx.AsyncClient) | ~42 min | 1.8x |
| + shared connection pool with keepalive | ~33 min | 2.3x |
| + OAuth pre-warm + background refresh | ~29 min | 2.6x |
| + token-bucket rate limit + stagger jitter (fix for the thundering herd) | ~13 min | 5.8x |
The 76 → 13 landed cleanly. The one honest note is that after the rate limiter, we were no longer network-bound on any single cloud. We were rate-bound by the clouds themselves. Squeezing further meant negotiating a higher quota with the cloud providers, which was an org-chart problem, not an engineering one.
What I'd do differently
Cache the aggregated result in Redis with a short TTL. The single biggest lever I did not pull was caching. The aggregated view rarely changes at second-level resolution, for a FinOps dashboard, a 30-second-old snapshot is indistinguishable from a live one. A Redis layer keyed on the request signature (cloud set + time bucket + auth scope), with a TTL of maybe 30-60 seconds, would push the perceived latency on the hot path from 13 minutes to sub-second for anyone hitting a cached signature. The cold-fetch path would still be 13 minutes; the human experience would be transformed. I didn't ship this inside the internship window and I'm flagging it explicitly here for whoever inherits the pipeline: the compute is already done, the box you need is the one in front of it.
A proper circuit breaker per cloud. Once during my internship, GCP's monitoring API had a bad afternoon in one region, and our fetcher kept hammering it, kept timing out, kept holding pool slots hostage. The pipeline as a whole degraded because one endpoint was sick. A circuit breaker that trips after N consecutive failures, backs off, and returns a stale-but-recent value for the affected slice would have made the aggregator degrade gracefully instead of dragging its feet.
Per-endpoint budgets, not one global timeout. The 30-second client timeout was the right choice for the median endpoint and the wrong choice for the p99 endpoint. A billing snapshot legitimately takes longer than a resource-inventory ping. A per-endpoint budget, informed by the last N observed latencies, would have let the fetcher fail fast on the ones that should be fast and be patient on the ones that shouldn't.
Stream the results, don't wait for the whole set. The dashboard couldn't render anything until every cloud's fetch had completed, but the dashboard didn't actually need every cloud's fetch to complete before rendering anything. A streaming response, Server-Sent Events or a WebSocket, that emitted each cloud's result as it landed would have made the first-paint latency roughly the fastest-cloud latency, not the slowest.
The transferable lesson
Multi-cloud aggregators look I/O-bound and they are, but most of the wall clock on any single request is fixed cost, not variable cost. TLS handshakes, DNS lookups, and OAuth exchanges dominate the actual API work by an embarrassing ratio. The optimization instinct, "make the API faster", is exactly the wrong instinct. The API is fine. The instinct that pays off is: pay the fixed costs once, share them across every request, and fan the variable work out concurrently.
The three fixes here, async fan-out, shared connection pool, pre-warmed OAuth, are all instances of the same idea. So is the caching layer I didn't ship. So is the streaming response I didn't ship. The pattern isn't "async is fast." The pattern is: identify the fixed cost, pay it once, amortize.
The kernels on the cloud side never got faster. The pipeline got ~6x faster anyway.
See also
- A dependency-free Go binary for 9,000 servers, the same
:00-of-the-hourthundering-herd shape shows up whenever a shared resource meets a synchronized client population. The fix rhymes: de-sync the workload or size for the peak.
More on the SAP Labs internship and the multi-cloud aggregator work is on the projects page.